
The average Bedford home was worth £331,113 in September, down 0.3% on August's record. The yearly rise slowed to 1.2%, the lowest since March 2025.
The average home in Bedford borough was worth £331,113 in September 2026. That is £1,111, or 0.3%, less than in August, when the average reached £332,224. August is now the highest figure the index has recorded for the borough.
Over a year, prices are still up. September’s average is £3,831, or 1.2%, above September 2025. But that is the slowest annual rise since March 2025, and the fourth month in a row that the rate has fallen.
The figures come from HM Land Registry’s UK House Price Index for September 2026, published on 18 November. The index average is a mean, not a median. A few very large sales pull it up, so it sits above what a typical Bedford home sells for.
How the annual rate has slowed
When the July figures were first published in September, Bedford was growing faster than any council around it. The current figures show how quickly that has cooled:
| Month | Average price | Change on a year earlier |
|---|---|---|
| May 2026 | £331,326 | +6.2% |
| June 2026 | £329,081 | +4.1% |
| July 2026 | £330,332 | +2.8% |
| August 2026 | £332,224 | +1.6% |
| September 2026 | £331,113 | +1.2% |
Prices themselves have barely moved since May. The rate is falling because last year’s comparison months were strong. Between June and September 2025 the borough average jumped from £315,981 to £327,282, according to the same index. Each month now measures against a higher starting point.
Every figure in the table is from the latest release. Land Registry revises recent months as late sales are registered, and these numbers are lower than those first published (see the note at the foot of this article).
Bedford against its neighbours
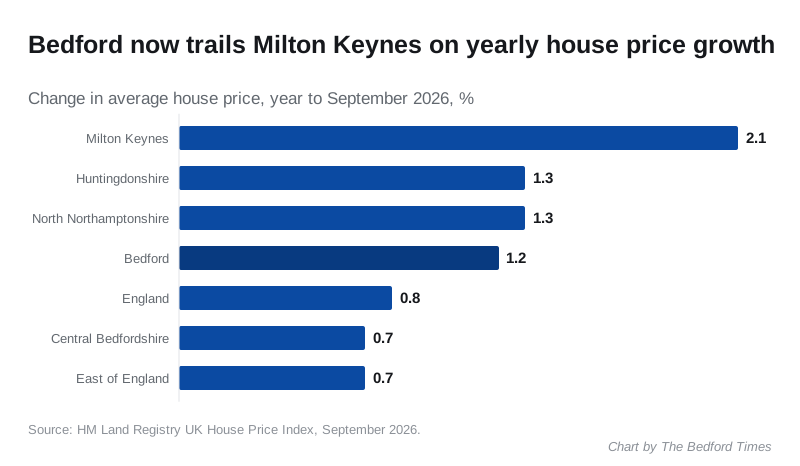
All figures are from the September 2026 release.
| Area | Average price | Change over the year |
|---|---|---|
| Milton Keynes | £326,491 | +2.1% |
| Huntingdonshire | £308,104 | +1.3% |
| North Northamptonshire | £255,834 | +1.3% |
| Bedford | £331,113 | +1.2% |
| England | £292,998 | +0.8% |
| Central Bedfordshire | £358,558 | +0.7% |
| East of England | £338,357 | +0.7% |
Sources: the index pages for Milton Keynes, Huntingdonshire, North Northamptonshire, Central Bedfordshire, England and the East of England.
Milton Keynes has overtaken Bedford on the pace of growth. Bedford is now fourth of the five councils in the table, ahead only of Central Bedfordshire. It is still rising faster than England and the East of England as a whole.
Bedford homes cost more on average than Milton Keynes, Huntingdonshire or North Northamptonshire. Central Bedfordshire, which includes Biggleswade and Sandy, is dearer by £27,445.
Prices by type of home
Borough averages for September 2026, with the change on a year earlier:
| Type | Average price | Change over the year |
|---|---|---|
| Detached | £561,847 | +0.9% |
| Semi-detached | £348,699 | +2.2% |
| Terraced | £277,883 | +1.7% |
| Flat or maisonette | £159,355 | -1.3% |
Semi-detached houses, the borough’s most common sale, are rising fastest. Flats are the only type falling. The average Bedford flat is still £3,538 below its November 2022 peak of £162,893.
First-time buyers
The average first-time buyer in Bedford paid £273,340 in September, up 1.5% on a year earlier. That is £28,288 more than the England first-time buyer average of £245,052.
What it means for you
If you are buying, the pressure has eased. Prices are flat since May, and a flat in Bedford costs less than it did a year ago.
If you are selling, values are holding close to their record. The August average of £332,224 is the highest on the index, above the previous peak of £320,717 in November 2022.
If you want to see what homes near you sold for, our Bedford house prices page has median sold prices for every postcode sector in the borough.
Sources
- UK House Price Index, Bedford, September 2026, HM Land Registry, for the average, monthly and annual change, type splits and first-time buyer average.
- UK House Price Index, Bedford, monthly pages from November 2022 to August 2026, HM Land Registry, for the series and previous peaks.
- UK House Price Index reports, for the release schedule and methodology.
Have your say